
Analytics Examples
The following dashboards utilize the power of Tableau Desktop and Tableau Public to display data dynamically to engage users to explore trends in an interactive medium and enables stakeholders to examine Key Performance Indicators (KPIs) to drive strategic data-driven insights used to enact change.
Tableau Dashboard and Story Projects
Enrollment Statistics: Office of the Registrar
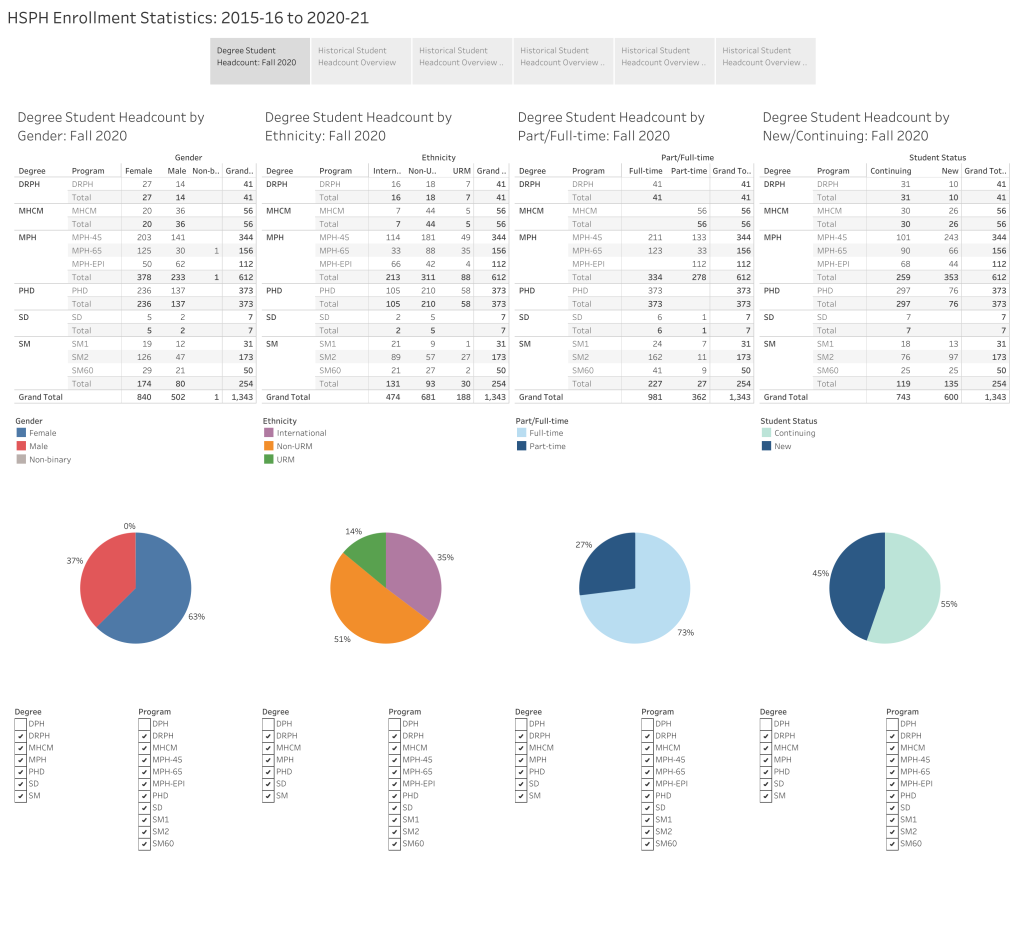
This dashboard provides the high-level reporting metrics and KPIs needed for student data through the Office of the Registrar. The data presented enabled multiple stakeholders across departments, offices, and disciplines to use the data presented for their individual reporting needs.
Click here to view this example on Tableau Public.
Analytics
Tableau | R & Studio | SAS